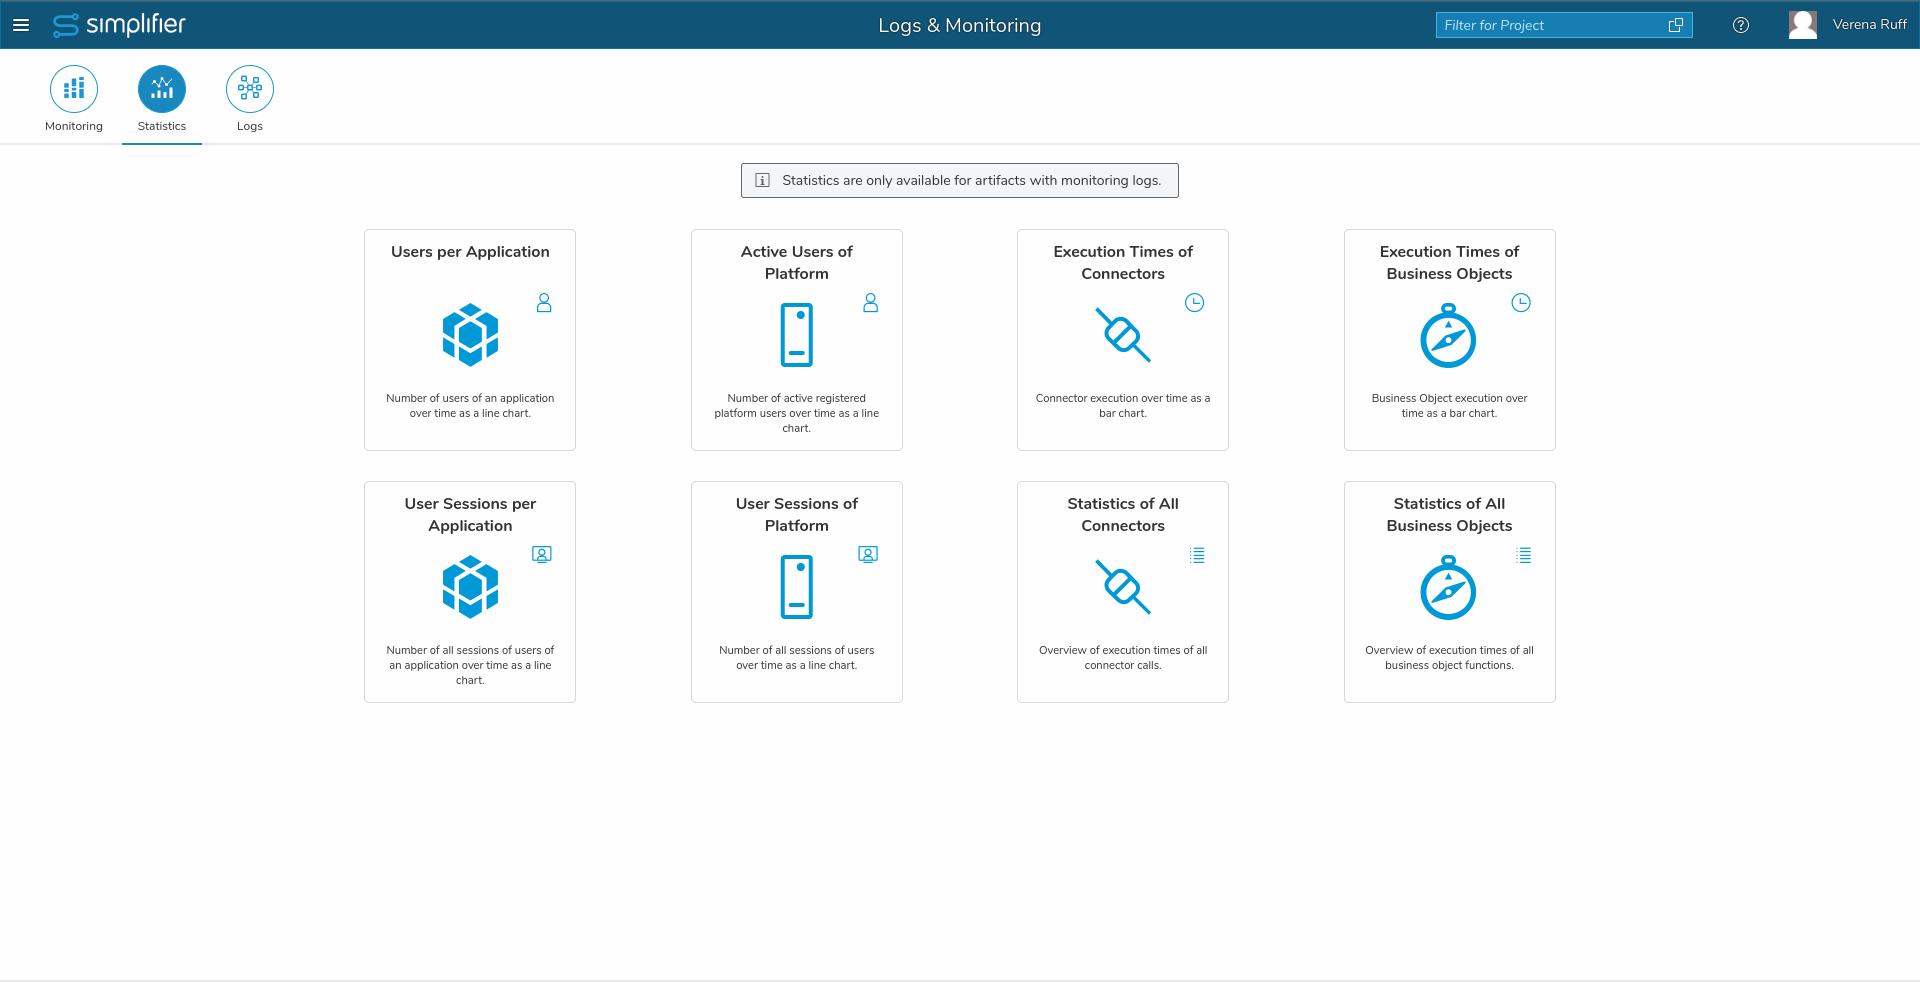
The statistics area gives access to different statistics showing the usage of applications, Simplifier Artifacts and the platform itselt.
General remarks valid for multiple statistics
All statistics need a timespan. The timespan is always preselected with the last month.
In statistics about users, often there is a switch wether anonymous users should be included or not. Anonymous users can’t be distingueshed, so it is not possible to find out how many different anonymous users there have been. If the switch “Include Anonymous Users” is set to true, the number of authenticated users is increased by one, if at least there was one anonymous user.
In many statistics it is possible to choose the interval. Possible intervalls are Day, Week, Month. During the chosen intervall the values are summed up.
Users per Application
This statistic shows how many unique users used a specific application within a given timeframe. If the same user used the application more than once within the given timeframe, it counts as 1.
User Session per Application
This statistic shows all user sessions for a specific application or all sessions for a specific user and a specific application.
It is neccessary that an application is selected. Selecting a user is optional.
If a user opens an appliciation multiple times, it counts as often as the application was started.
If a user is selected, one sees how often an application was started by that selected user.
Active Users of the Platform
This statistic counts the unique user who used the platform.
User Sessions of the Platform
A statistic about how man user sessions were started with applications on the plattform.
Execution Times of Connectors
This statistic shows the exectution times of a connector call. You need to specify a connector and one of its calls.
Within each interval (day, week, month), three bars are shown, if the connector call was at least once executed during this interval. The first bar shows the shortest execution, the third bar shows the longest execution. The bar in the middle shows the average execution time (arithmetic mean).
Statistics of all Connectors
This statistic shows a table listing all connector calls. For each connector call, the following information is shown:
- Minimum: the shortest execution time
- Average: the average execution time (arithmetic mean)
- Maximum: the longest execution time
- Sum: the sum of all executions of the specific connector call
- Count: how many singular connector calls were executed
- Last Execution: when was this connector call executed the last time
All columns are sortable by clicking on the table header.
Execution Times of Business Objects
This statistic shows the exectution times of a business object function. You need to specify a business object and one of its functions. Only Server Side Business Objects are supported.
Within each interval (day, week, month), three bars are shown, if the business object function was at least once executed during this interval. The first bar shows the shortest execution, the third bar shows the longest execution. The bar in the middle shows the average execution time (arithmetic mean).
Statistics of all Business Objects
This statistic shows a table listing all business object functions. For each business object function, the following information is shown:
- Minimum: the shortest execution time
- Average: the average execution time (arithmetic mean)
- Maximum: the longest execution time
- Sum: the sum of all executions of the specific business object function
- Count: how many singular calls of the business object function were executed
- Last Execution: when was this business object function executed the last time
All columns are sortable by clicking on the table header.


