You can easily debug Simplifier Apps by open the Web Developer Tools in Chrome
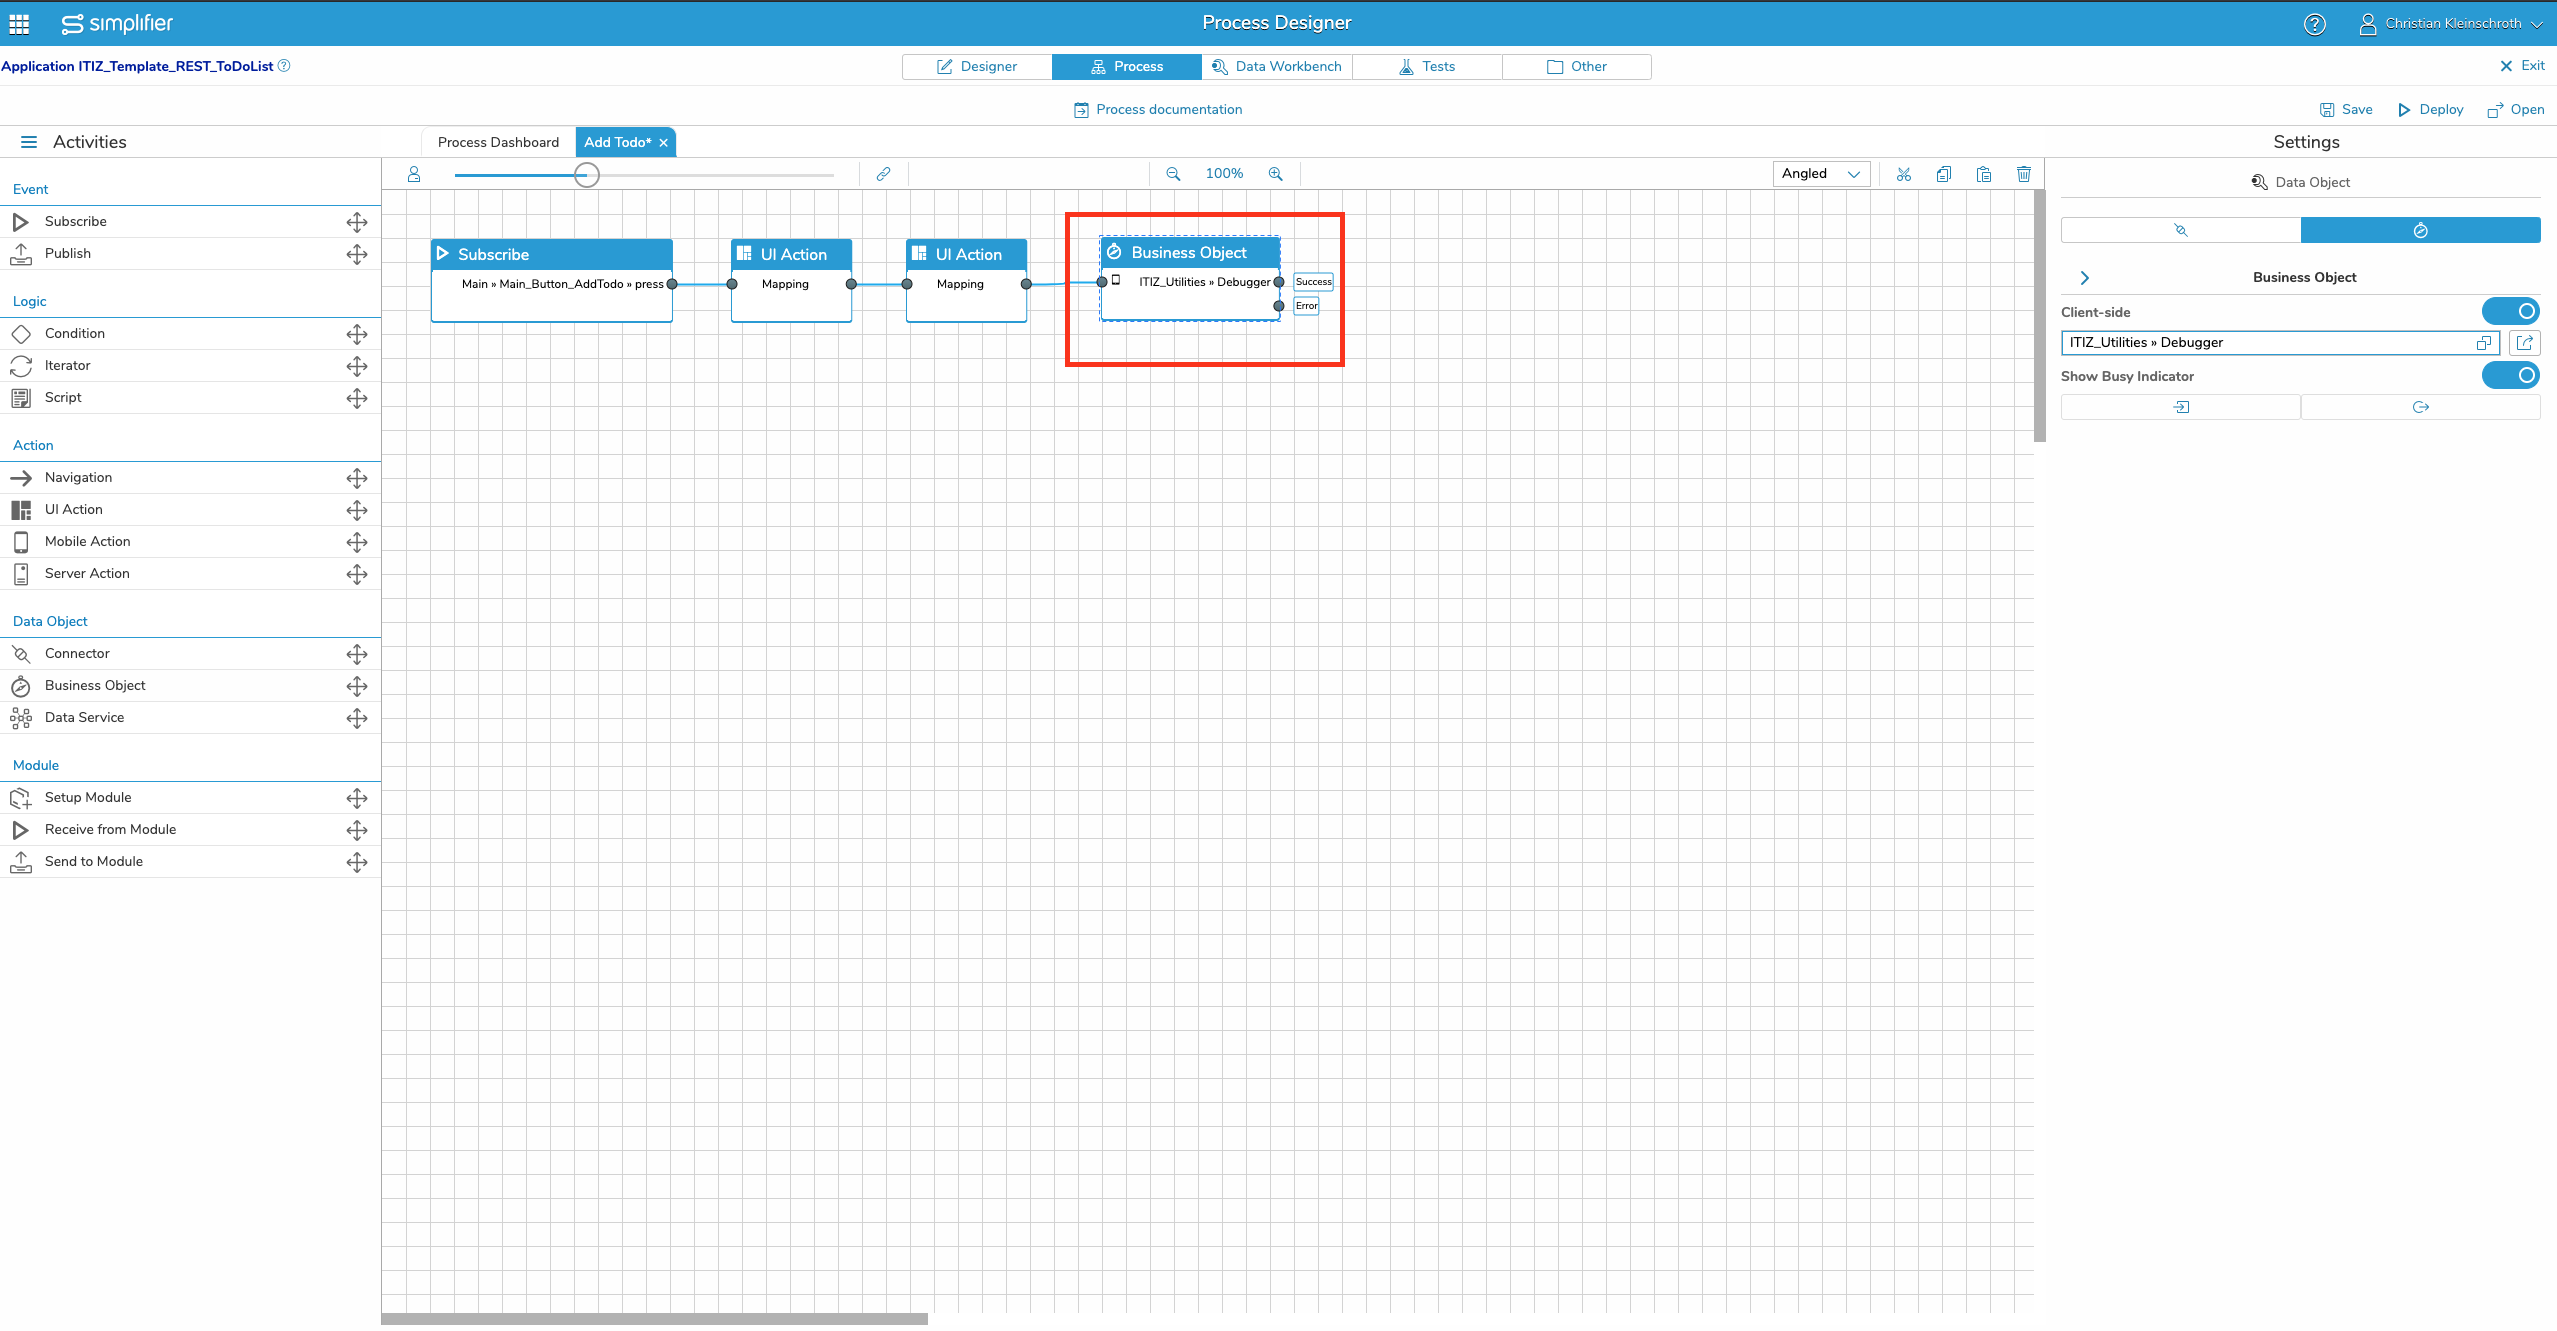
Step 1 – Set Breakpoint in Process Designer
Add a new Business Object and activate the Client Side Switch on the right side
Choose the Business Object ITIZ_Utilities and the function Debugger
Step 2 – Deploy and Open Simplifier App in Browser
After you deployed the app, open the Chrome Developer Tools by pressing the following keys on the keyboard:
| Windows/Linux | F12 or Control+Shift+I |
| Mac | Command+Option+I |
After the console is visible on the screen, execute the corresponding configuration within the user story to hit the breakpoint.
For more information, about the possibilites of chrome web developer debugging , read the official documentation.
Step 3 – Search for other User Stories
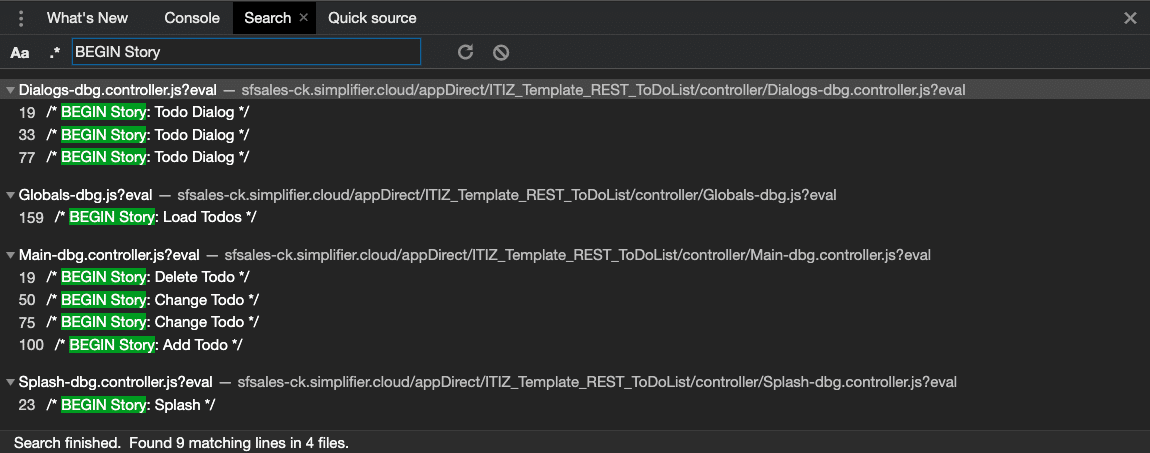
You can search for the other User Stories also direct in the source code
Enable the Search Feature
| Windows/Linux | Control+F |
| Mac | Command+F |
Search for BEGIN Story
You can jump directly in the generated source code by clicking in one of the search result


