- start creating Apps with Low Code
- Enroll in Courses and get certified
- gain full access to the Simplifier Community
- Watch Webinars and Related Videos
- Browse the Documentation and Knowledge-Base
- Read Frequently Asked Questions
- Download reusable Content from the Marketplace
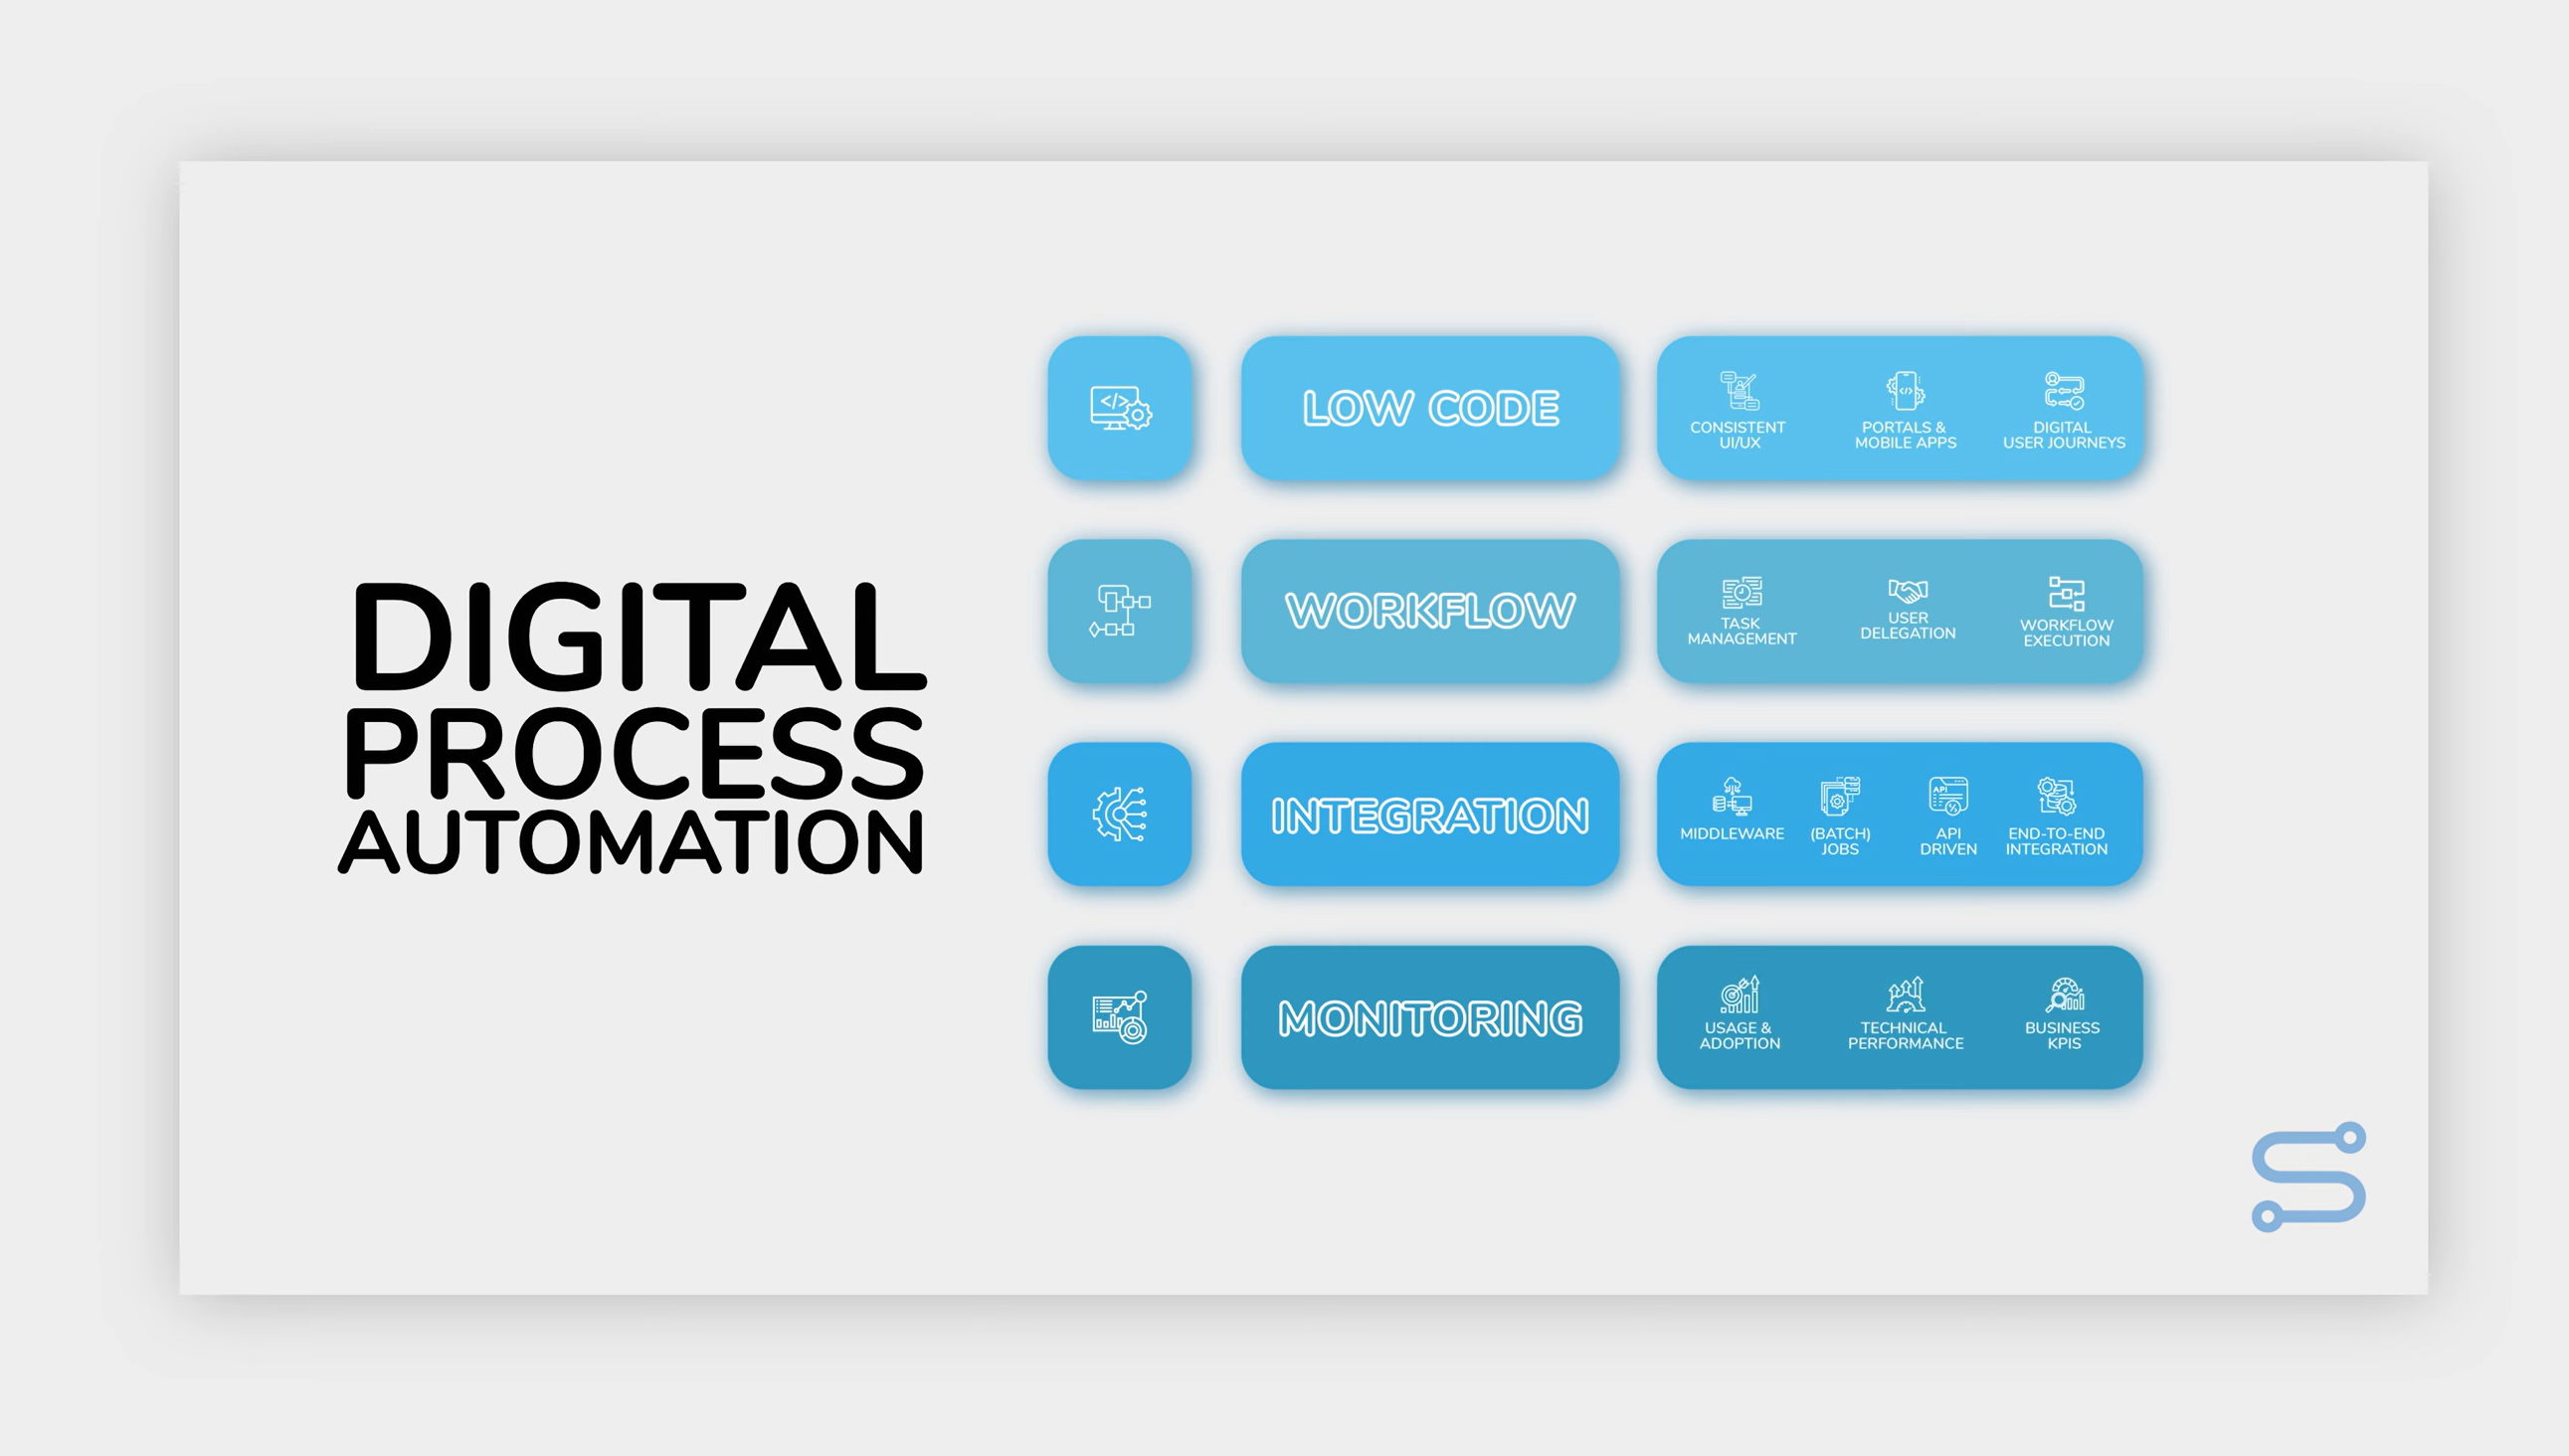
Simplifier is a Low Code Development Platform for Digital Process Automation
It combines Application Creation with Workflow Automation and Integration as-a-service.
Try Simplifier now and ...
120K
End Users
4294
App Builders
5000+
Deployed Apps
Develop custom user-centric digital solutions
leverage state-of-the-art User Experience and create Apps that users love


Visual UI Design and Application Logic
say goodbye to high development costs and time-consuming coding and embrace flexibility and adaptability
Integrate Systems & Transform Data
easily integrate existing IT landscapes, legacy systems, and cloud services and perform complex data transformation ensuring seamless communication among diverse systems.


Create flexible workflows
automate your processes, create Workflows integrated in your existing IT landscapes, legacy systems, and cloud services.
Enterprise Mobile App Development redefined
- Develop, Update, and Preview Cross-Platform Apps in Realtime
- Use powerful native device features with ease
- Test your app on all devices simultaneously
- Collaborate with users and gather instant feedback
- Execute Automated Tests on the fly
- Dedicated Developer Mode for Logs and Debugging


See it in Action
Become a Simplifier App Builder
Learn how to use Simplifier with our Free Online Courses

Learn Anything Online
Enroll for free in Self-Service Online Courses

Valuable Certificates
Get certified for intermediate and advanced Level App Creation with Simplifier

Prove your Skills
and become a Simplifier Advanced Citizen Developer